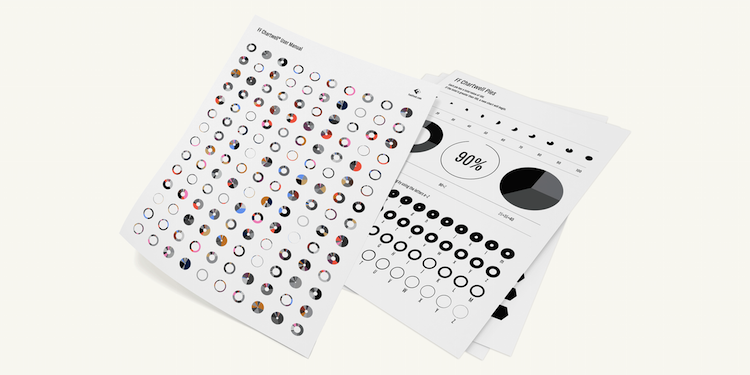
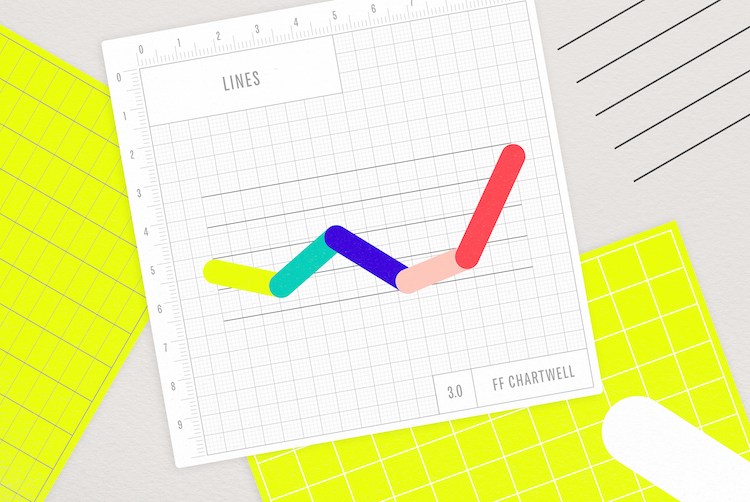
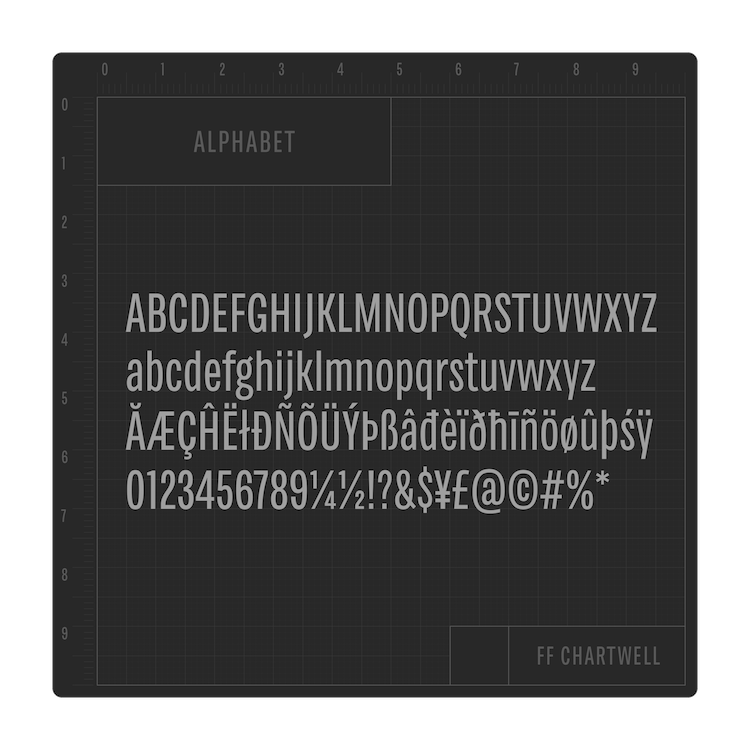
As a designer, we all know how difficult it is to make complex information easier to take in through compelling and effective visuals. ‘Driven by the frustration of creating graphs within design applications and inspired by typefaces such as FF Beowolf® and FF PicLig™, designer Travis Kochel saw an opportunity to take advantage of OpenType technology with an aim to simplify the process. FF Chartwell was therefore created to make charts out of simple text strings. It isn’t like other typefaces in that its letters and figures are not intended to be displayed; they only serve as placeholders for chart and graph elements.
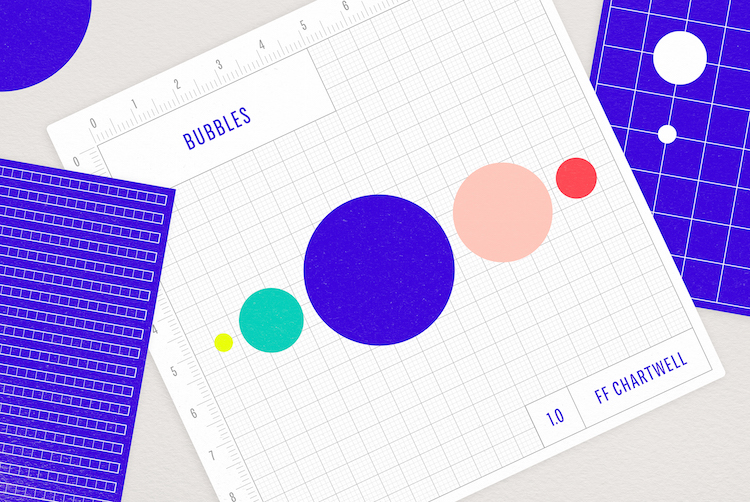
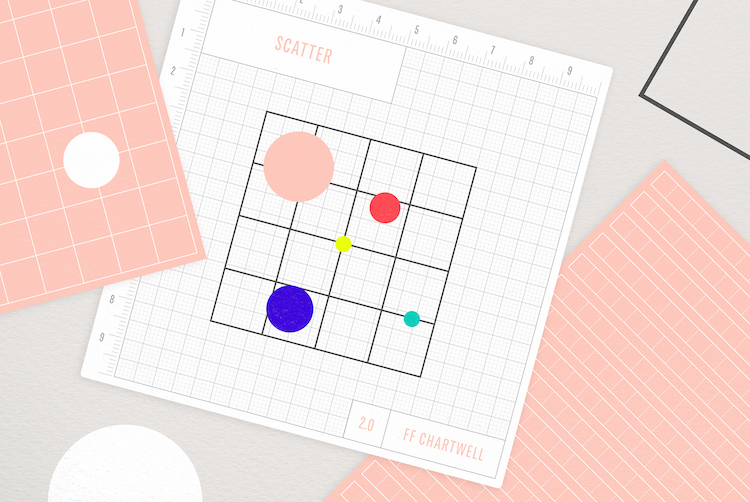
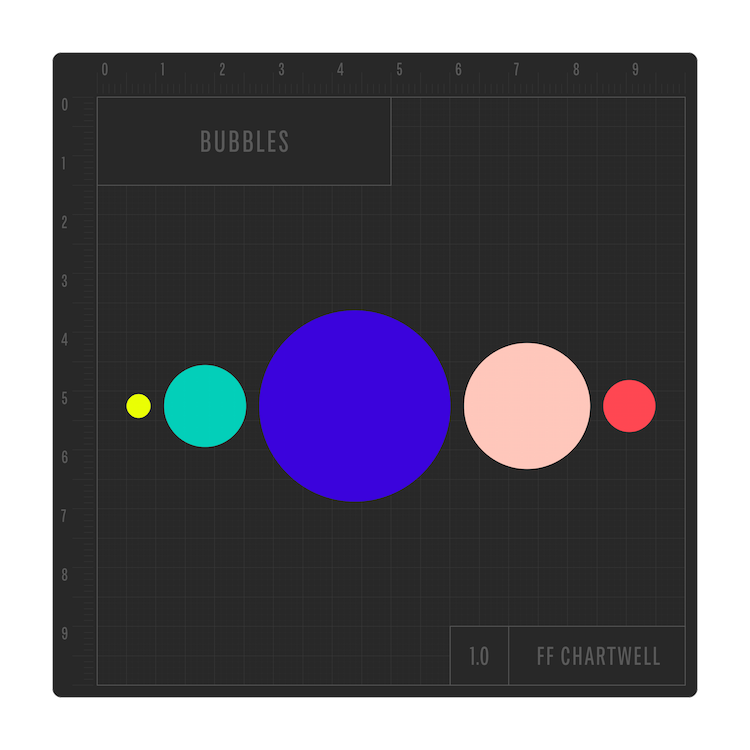
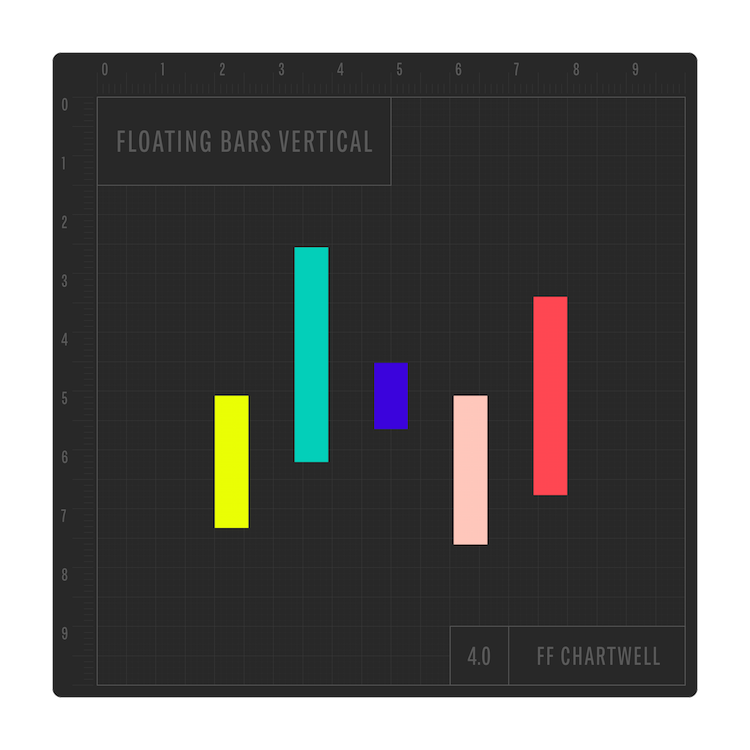
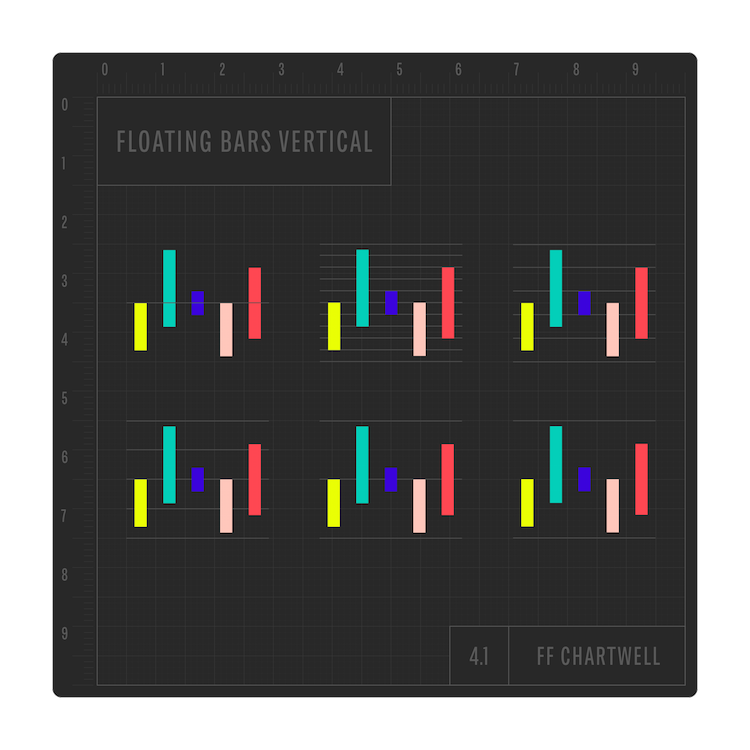
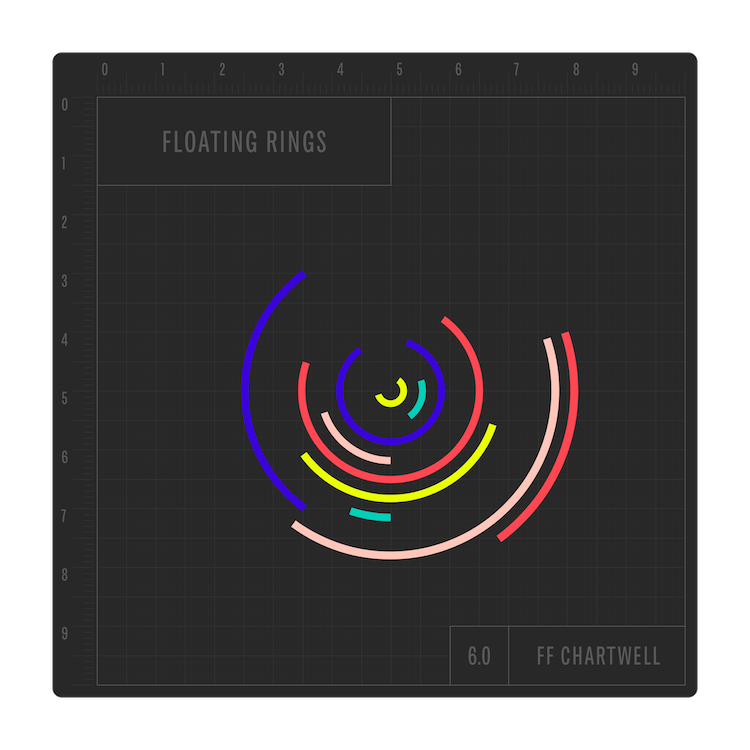
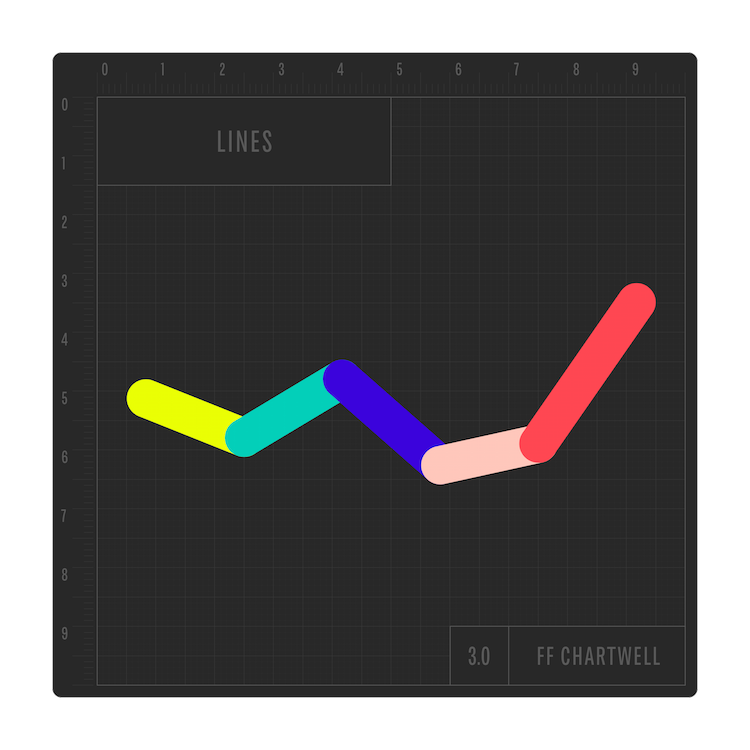
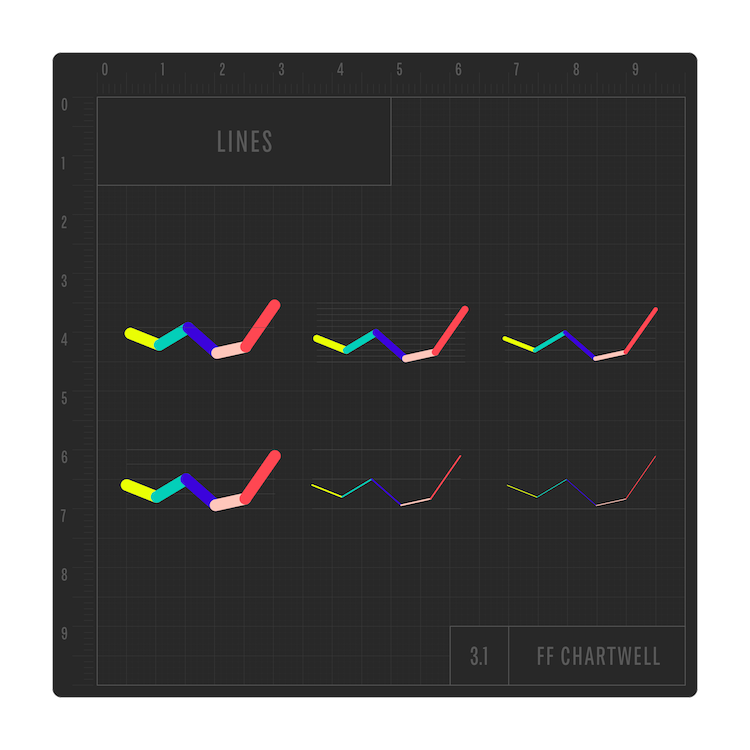
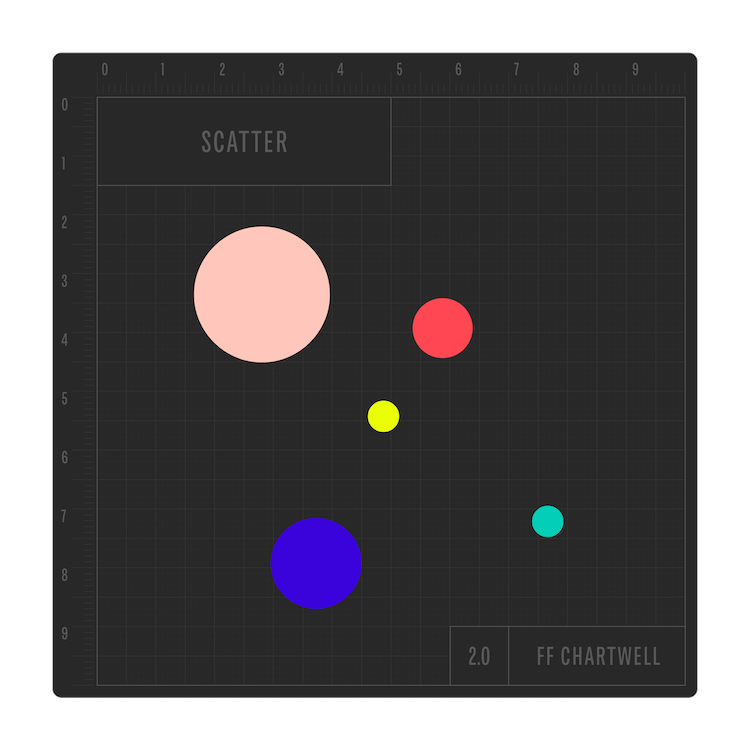
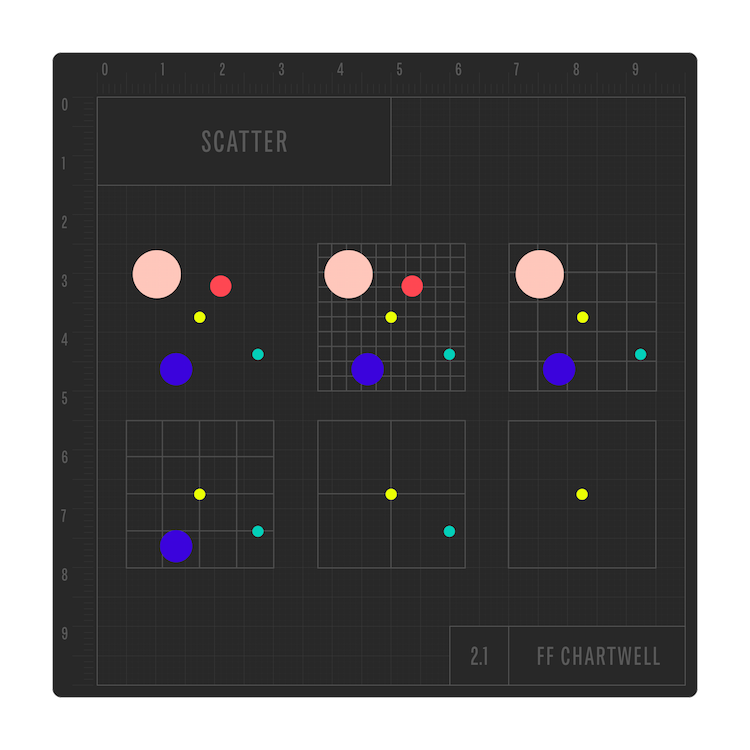
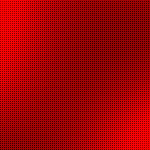
Using FF Chartwell could not be any simpler. For example, you can just type in a series of numbers like “10+13+37+40”, turn on Discretionary Ligatures, this string of numbers will then be automatically transformed into a graph. The data remains in a text box, allowing for easy updates and styling.
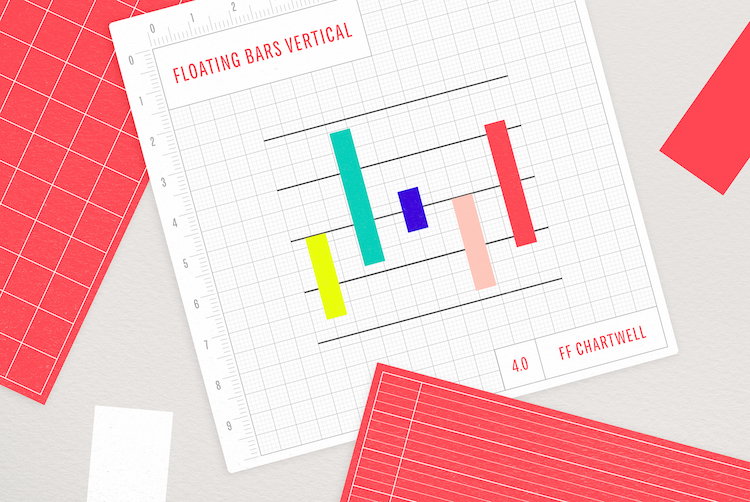
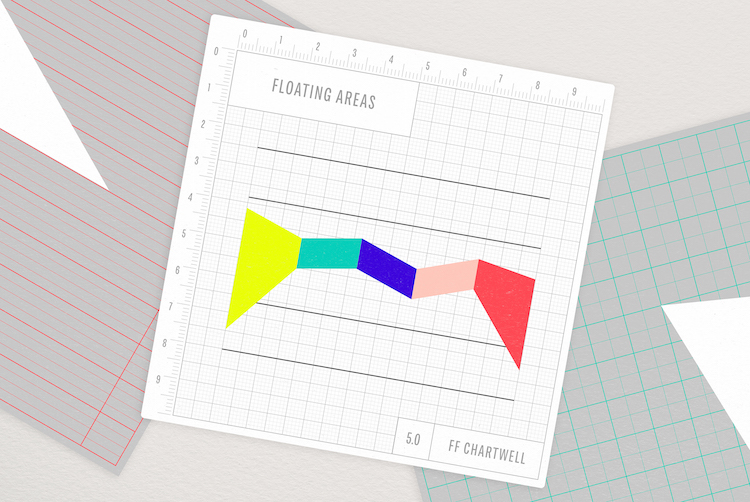
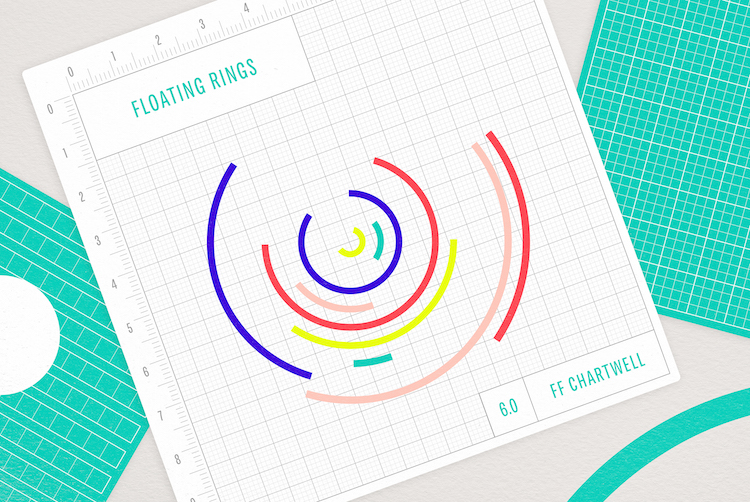
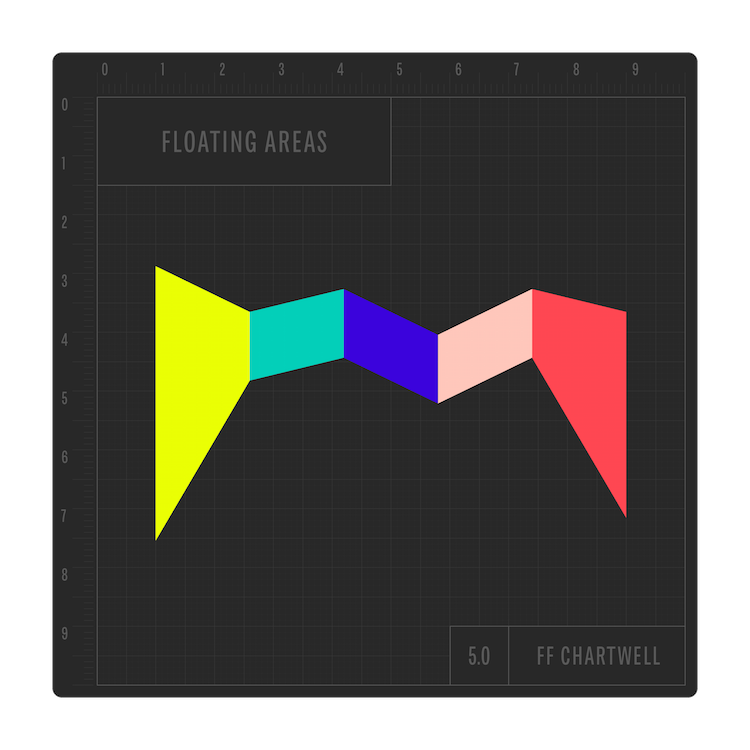
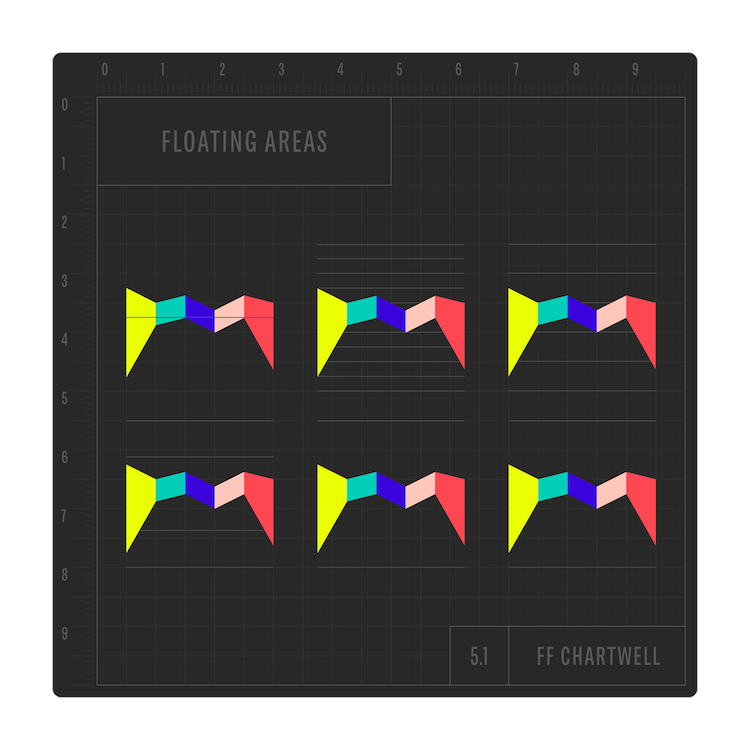
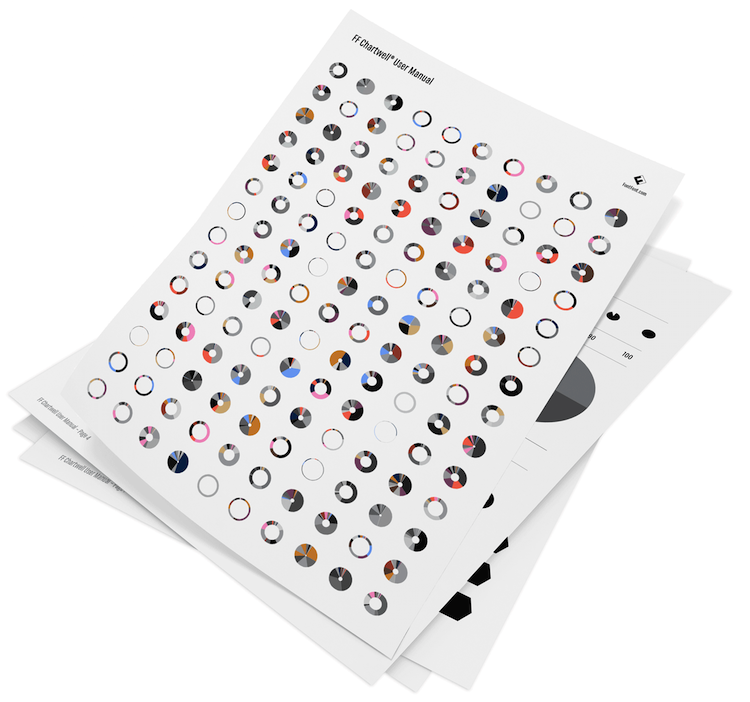
The FF Chartwell story began with a graph-heavy print product produced in Indesign and the question ‘Couldn’t some of this be automated?’. Originally released in 2011 under the TK Type Foundry, today, the series has been updated and now includes six new chart styles. Very versatile, beautiful and functional, FF Chartwell is truly a game-changing design that adds a whole new dimension to the world of infographics.

www.fontfont.com
www.monotype.com
www.traviskochel.com
www.scribbletone.com
You might like...
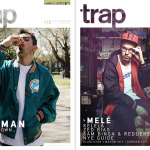
 Brothers of the Stripe
- Foilco: Smudge
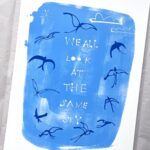
- Caroline Tomlinson | We All Look at the Same Sky
- LRG :: Holiday 13
- UNITED ARROWS :: 25th anniversary
- Drop Dead :: The Print & Design Factory
- Erin Hollingshead
- People of Print :: Studio Mail
- Water Stories | The Global Water Crisis in Pictures | Mustafah Abdulaziz
- Age of Reason Scarves
- Intercity | Men of Style
- Josh Geoghegan
- Chase Me :: The World’s First 3D-Printed Film
- Open Call to Submissions :: Reflect | GDFB
- Beautiful Soul – For the love of Ladybirds
- Cyril Galmiche


anna@peopleofprint.com
- Icinori - February 9, 2021
- Sergio Membrillas - December 18, 2020
- La Perruque: Type Magazine - December 8, 2020